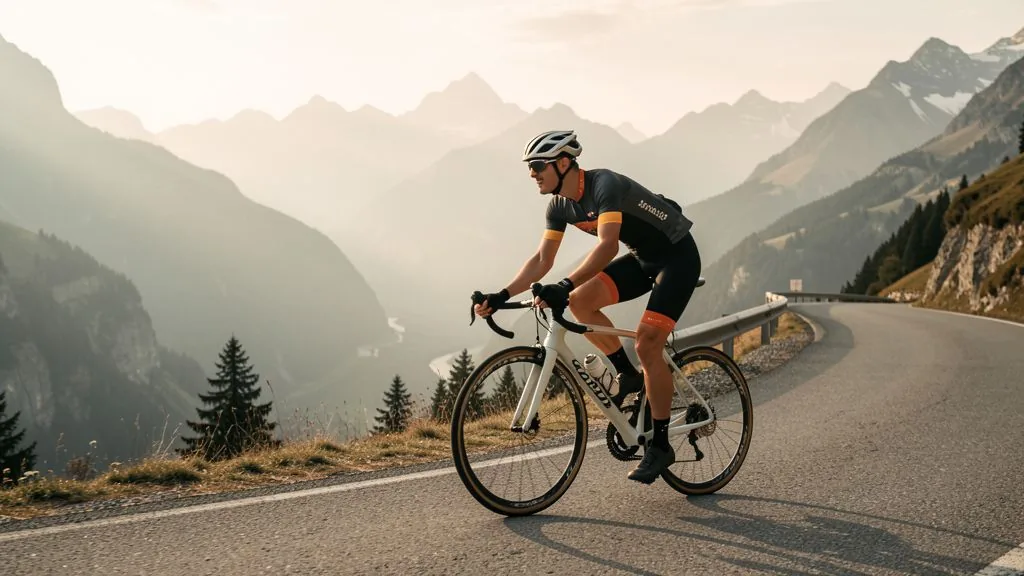
A power meter is the only metric in cycling that does not lie. Heart rate responds with a delay, depends on coffee, heat and sleep, and drifts upwards on long rides. Wind, rolling resistance and weight distort every speed reading. Watts, by contrast, describe exactly the work you are doing at the pedal — in real time, unaffected by daily form or weather. That is precisely why power measurement is not a gadget for professionals but the tool that makes structured training controllable in the first place.
Why watts are the honest metric in cycling
The decisive difference is physics: power is work per unit of time, measured directly at the crank arm, in the hub or in the pedal. If you push 250 watts, you push 250 watts — uphill, in the slipstream, at 8 degrees or at 30 degrees. Heart rate can vary by 15 to 20 beats at the same power output: a coffee two hours earlier, poor sleep or 28 degrees outside shift your heart rate without changing your actual performance.
On top of that comes cardiac drift: at constant power, heart rate rises by 5 to 10 percent over two to three hours because blood volume drops and thermoregulation costs work. If you train by heart rate, you automatically get slower in the second half of a long climb — not because you are weaker, but because the instrument drifts. With watts, the target stays stable, and for the first time you see honestly what you are actually producing.
The practical benefit in numbers: an interval of "5 × 5 minutes at 105 % FTP" is an objectively verifiable task. "5 × 5 minutes hard" is an interpretation. That translation of feel into measurements is the difference between a training plan and a training wish — and it is the foundation of any serious load management, from sweet spot training to race pace in a gran fondo.
The four measurement systems compared
Power meters measure at four different points in the drivetrain. The measurement position determines what is actually captured: crank and pedal systems measure before drivetrain losses, hub systems measure after — chainline losses and drivetrain friction of two to four percent have already been deducted there.
- Pedal power meters: Swappable in minutes, portable between bikes, available dual-sided. They are the most flexible option for anyone with several bikes — but they sit in the pedal, where crashes and ground contact can hit them. Price: around 500–1,100 euros per pair.
- Crank power meters: The classic. Single-sided versions (left crank arm only) start at about 350 euros, dual-sided between 700 and 1,200 euros. More robust than pedals, invisible in training, but tied to a crank standard (Shimano, SRAM, FSA) and not portable between bikes.
- Spider power meters: The electronics sit in the chainring spider. Light, dual-sided and very accurate (often ±1 %), but expensive and bound to a specific crank arm standard. Price: 700–1,200 euros.
- Hub power meters: Measurement happens in the rear hub, robust and low-maintenance. Downside: tied to one wheel, no bike swap, no rim upgrade without a rebuild. Price: from around 600 euros plus wheel.
For the vast majority of recreational and ambitious riders, a single-sided crank or a pedal system is the most sensible entry point: the error from doubling the left side is below five percent for most riders — and for training control it is consistency that counts, not the absolute number.
Installation, calibration and your first numbers
A power meter is only as good as its setup. Three steps decide whether the numbers are usable:
- Zero-offset calibration: Before every key session, at least once a week, and always after a temperature change of more than 10 degrees. Calibration takes about 10 seconds, the crank arm must be stationary — most bad readings in the amateur world come from a forgotten calibration in the cold.
- Keep an eye on battery level: Button cells last 150 to 400 hours depending on the system. As voltage drops, values become inaccurate before the unit shuts down. A spare set belongs in your saddle bag.
- Keep firmware current: Manufacturers regularly correct temperature compensation and auto-zero functions via updates. Two minutes in the app before the season is time well spent.
For the bike computer: instantaneous power (1 s) is useful in a sprint, but for intervals and long sessions the 3-second average is the better display — it smooths the natural fluctuation between dead spot and power phase. Anyone watching the 1-s display during an interval chases a twitching number and rides erratically. A 10- or 30-second smoothing, in turn, is ideal for steady threshold blocks.
Finding your FTP — and what it tells you
Functional Threshold Power is the highest power you can hold for roughly an hour without lactate continuing to rise. It is the anchor for all training zones. Two test formats have established themselves:
- 20-minute test: Go all out for 20 minutes after a 5-minute blowout, then take 95 % of the average. Fast but demanding — and 3 to 5 percent too high if you take the test too fresh.
- Ramp test: Step up by 20 to 25 watts per minute until failure; FTP sits at about 75 % of the final minute. Less taxing, well repeatable, but dependent on step length. How the two relate is explained in the article on FTP testing and watt training.
Important: FTP is not a fixed constant but a snapshot. After a two-week break or an altitude camp it is a different number. That is why you retest every six to eight weeks — and not after every hard week. Training zones by FTP sit roughly at 55–75 % (Z2, base), 88–94 % (sweet spot), 95–105 % (threshold) and 106–120 % (VO2max). For context on terms such as watts per kilo or critical power, a look into the training literature is worthwhile.
A reality check many skip: if your FTP figure comes from a winter test and you train with the same zones in spring, you are very likely training too easy. Conversely, an FTP set too high means every "base ride" in fact lands in the sweet spot.
Training zones and what they do
Seven zones have become established in cycling — for recreational riders five are enough. What matters is not the number of zones but that you can distinguish them and actually respect the boundaries.
- Z1 (up to 55 % FTP), active recovery: 60–90 minutes easy, conversation no problem. Accelerates recovery, costs almost no fatigue.
- Z2 (56–75 %), base: The bulk of your volume. Mitochondria, fat metabolism and capillarisation grow here — the foundation for everything else. Ride Z2 too hard and you lose most of the training effect, because the stimulus already sits in carbohydrate metabolism.
- Z3 (76–90 %), tempo: Useful for long rides with pressure, but in excess the classic "grey zone": too hard for base, too easy for threshold.
- Z4 (91–105 %), threshold: 2 × 20 minutes or 3 × 12 minutes at 95 %. The strongest lever for FTP itself.
- Z5 (106–120 %), VO2max: 5 × 4 minutes with 4-minute recoveries. Short, hard stimuli that raise maximal oxygen uptake — use sparingly in winter.
For winter training on the trainer: riding indoors by watts is a huge advantage because resistance is reproducible and there are no traffic stops. A structured plan with sweet spot blocks delivers more on the trainer than any unstructured ride — details in indoor trainer training.
The most common mistakes with power data
- Comparing two systems. Pedal says 250, trainer says 235 — that is normal. Different measurement positions, drivetrain losses and calibrations produce systematic deviations of 3 to 8 percent. Only compare values from the same device.
- Copying zones from the internet. Generic tables without reference to your own FTP are worthless. And anyone who estimates rather than tests their FTP trains permanently at the wrong intensity.
- Riding every session by watts. Power is a control instrument, not an end in itself. Easy rides may run by feel; a glance at the number every 10 minutes is entirely enough.
- Over-interpreting left-right balance. Fluctuations of 45/55 are considered normal. Only persistent asymmetry beyond 55/45 is a signal worth discussing with a physio or bike fitter.
- Working without data backup. A power meter without regular uploads to an analysis platform is an expensive bike computer add-on. The data has to flow into your training history, otherwise the week-to-week comparison is missing.
One last point that is often underestimated: power measurement changes how you train — not just how you measure. Once you know your numbers, easy sessions suddenly become genuinely easy and hard sessions genuinely hard. That discipline, not the device, produces the progress.
What a power meter changes in training
The real gain is not in the device but in the consistency it forces. Three observations come up for almost every rider who starts training with watts: the easy sessions suddenly become much easier (because 180 watts feels different from "comfortable"), the hard sessions become consistently hard (because the drop-off after two minutes becomes visible), and the grey zone disappears. In sum, this shifts your intensity distribution towards the polarised model — without riding a single extra kilometre.
For season planning it means you can document load objectively and compare it across weeks using metrics such as TSS and training load. That makes it visible whether a hard week really was hard or only felt hard — and whether your volume increase stays within reason. This is exactly where most overtraining and injury problems originate: not from too much training, but from too much moderate intensity without any measurement control.
Frequently asked questions about power meters
Do I need a power meter as a recreational cyclist?
Not strictly, but it is the most useful investment after a bike computer. If you train in structured intervals, watts control intensity far more precisely than heart rate, which shifts with heat, caffeine, sleep and daily form.
How accurate are power meters?
Good systems are accurate to about 1 to 2 percent. Consistency matters more than the absolute number: the same unit returns reproducible values, while two different units will differ slightly from each other.
Single-sided or dual-sided measurement?
Single-sided is enough for training control as long as you have no major left-right asymmetry. Dual-sided makes sense if you want to check asymmetry after injury or compare values between two systems.
How often should I calibrate a power meter?
Before every key session, at least once a week, and always after a temperature change of more than 10 degrees. Zero-offset calibration takes about 10 seconds in the app and must be done with the crank arm stationary.
What does a good power meter cost?
Single-sided crank systems start at around 350 euros, dual-sided pedal or crank systems usually cost between 700 and 1,200 euros. Hub power meters start at about 600 euros but require a matching wheel.
How Peakora works with your power data
Peakora takes your power data from Strava, Polar, Suunto or a FIT file import and calculates your FTP and zones from it — no generic tables to fill in. The plan then sets the right stimuli automatically: base rides stay genuinely in Z2, threshold blocks get exact watt targets, and in winter the indoor trainer plan replaces the road ride. If your load climbs too fast, the adaptive planning steps in and reduces volume or intensity instead of letting you slide into the grey zone. Every session is explained — you can see why 3 × 12 minutes at 95 % is on the plan today and not 5 × 4 minutes at 115 %.
Train by watts — with Peakora
Automatic FTP calculation, zones from your real data and intervals with exact watt targets. Start free, no credit card required.
Start free